Here you've got lessons' files.
Debug PostProcessor
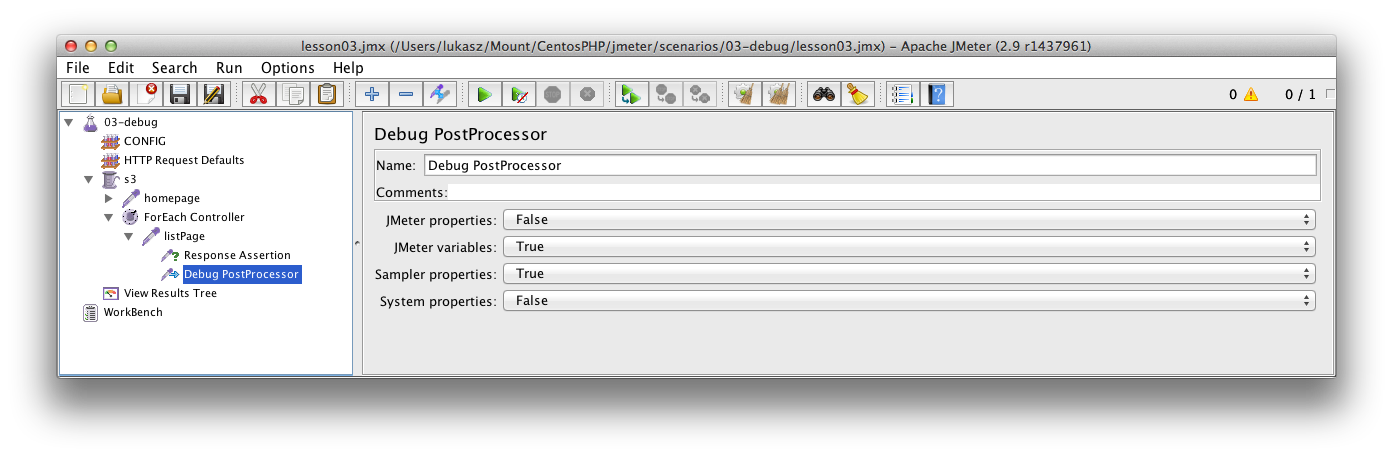
To add "break point" you can click right on your test three. The path to the element looks like: Add > Post Processors > Debug PostProcessor Add this element into the place which you want to debug.
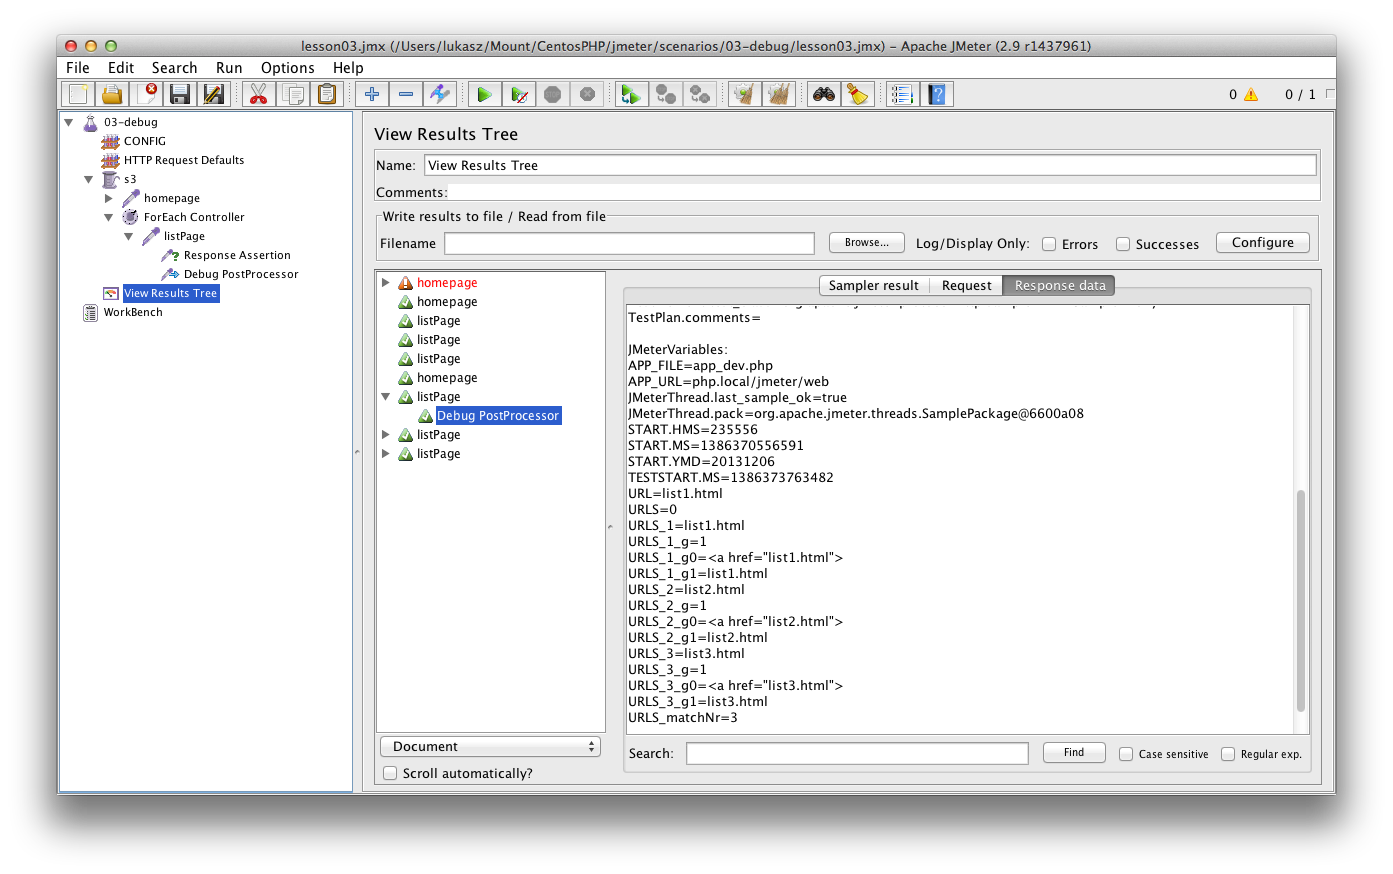
Next, run your test. In view result three you can find your debug information. On following screen you see URLS array from previous lesson. As you can see there is nothing easier than debugging ;)
Console log (BSF PostProcessor)
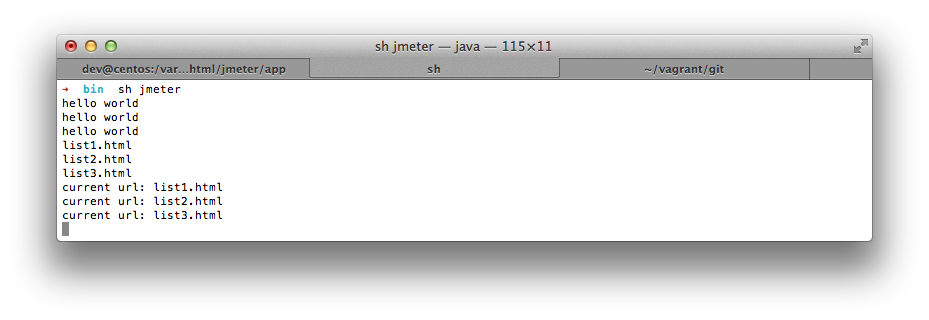
Sometimes you need debug your post processor script or you don't have an access to GUI mode. Then you can use "console log". Firstly, run jmeter from command line. Using sh jmeter command in /yourjmeterdirectory/bin. Secondly, add Post procesor BSF into your HTTP request. You can find the element in add > post processors > BSF PostProcessor. In this element you can write a lot of "magic". Here you can also process your data and prepare data for next test. But now I'll show you only writing on console log. It's great that you can choose your language. I'm using javascript now.
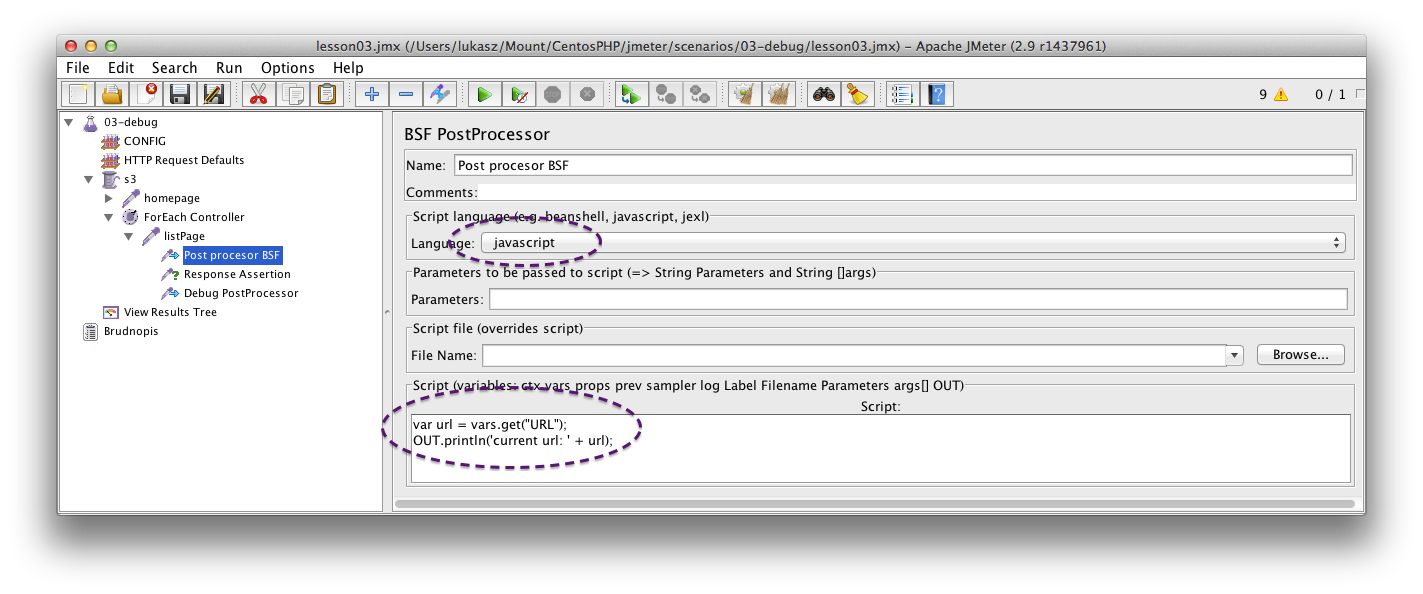
This simple code gets script variable and prints the value on console.
It's time to debug something.. Don't forget to send me a feedback using Discus.
comments powered by Disqus